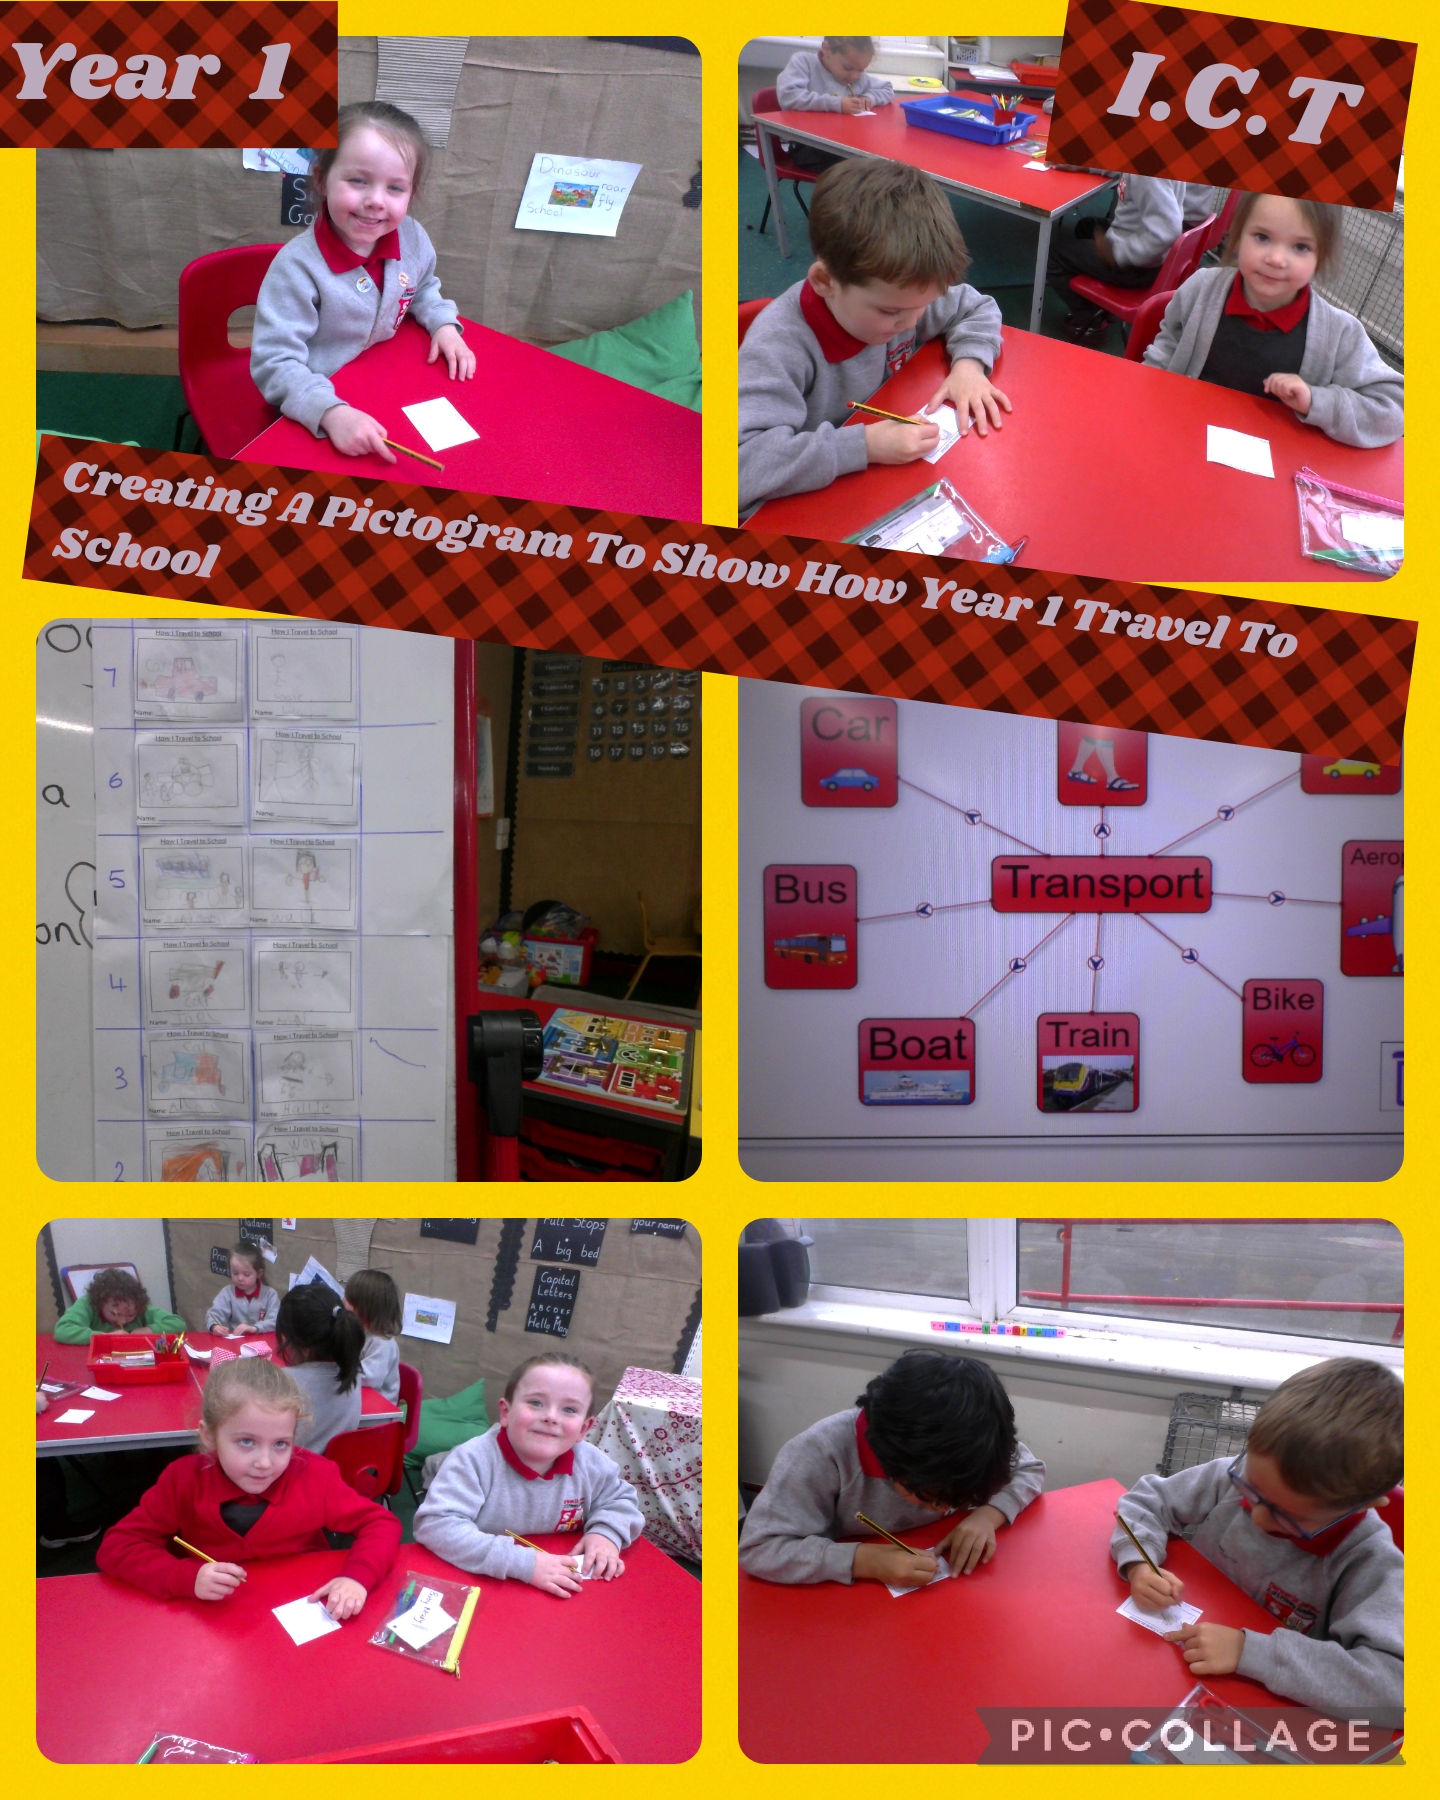
Year 1 collected data from the class about the different ways in which we travel to school. We drew pictures to show our individual data and then created a pictogram to show the information visually. Later, we used our pictogram to talk about the number of children that travel in different ways.

.png)
